|
|
|
|
|
|
|
|
|
|
|
|
|
|
|
| Tue, 19th May 2020 13:28:00 |
|
Temporary reduction in daily global CO2 emissions during the COVID-19 forced confinement |
Abstract
Government policies during the COVID-19 pandemic have drastically altered patterns of energy demand around the world. Many international borders were closed and populations were confined to their homes, which reduced transport and changed consumption patterns. Here we compile government policies and activity data to estimate the decrease in CO2 emissions during forced confinements. Daily global CO2 emissions decreased by –17% (–11 to –25% for ±1?) by early April 2020 compared with the mean 2019 levels, just under half from changes in surface transport. At their peak, emissions in individual countries decreased by –26% on average. The impact on 2020 annual emissions depends on the duration of the confinement, with a low estimate of –4% (–2 to –7%) if prepandemic conditions return by mid-June, and a high estimate of –7% (–3 to –13%) if some restrictions remain worldwide until the end of 2020. Government actions and economic incentives postcrisis will likely influence the global CO2 emissions path for decades.
Main
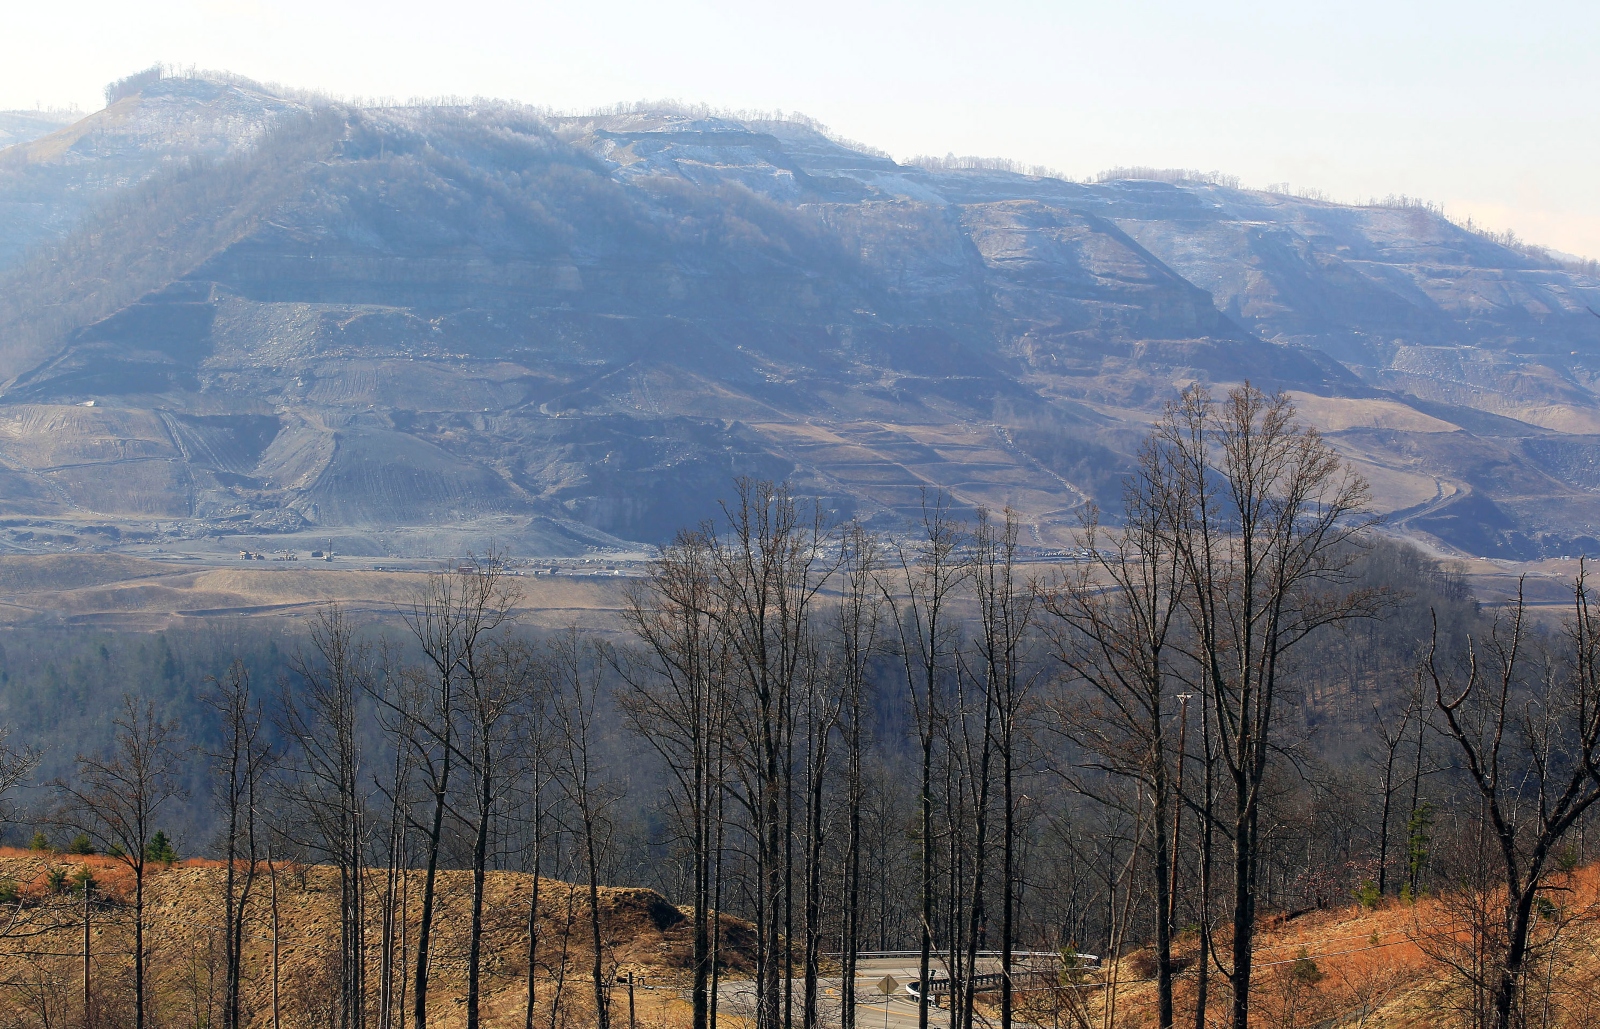
Before the COVID-19 pandemic of 2020, emissions of carbon dioxide were rising by about 1% per year over the previous decade1,2,3, with no growth in 20193,4 (see Methods). Renewable energy production was expanding rapidly amid plummeting prices5, but much of the renewable energy was being deployed alongside fossil energy and did not replace it6, while emissions from surface transport continued to rise3,7.
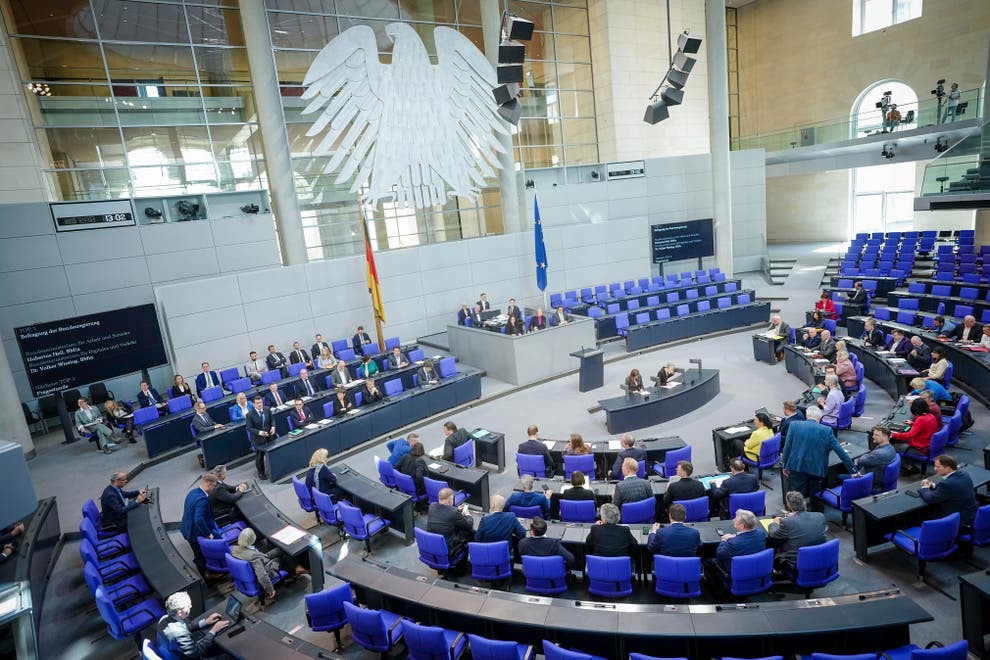
The emergence of COVID-19 was first identified on 30 December 20198 and declared a global pandemic by the World Health Organization on 11 March 2020. Cases rapidly spread, initially mainly in China during January, but quickly expanding to South Korea, Japan, Europe (mainly Italy, France and Spain) and the United States between late January and mid-February, before reaching global proportions by the time the pandemic was declared9. Increasingly stringent measures were put in place by world governments in an effort, initially, to isolate cases and stop the transmission of the virus, and later to slow down its rate of spread. The measures imposed were ramped up from the isolation of symptomatic individuals to the ban of mass gatherings, mandatory closure of schools and even mandatory home confinement (Table 1 and Fig. 1). The population confinement is leading to drastic changes in energy use, with expected impacts on CO2 emissions.
Despite the critical importance of CO2 emissions for understanding global climate change, systems are not in place to monitor global emissions in real time. CO2 emissions are reported as annual values1, often released months or even years after the end of the calendar year. Despite this, some proxy data are available in near-real time or at monthly intervals. High-frequency electricity data are available for some regions (for example, Europe10 and the United States11), but rarely the associated CO2 emissions data. Fossil fuel use is estimated for some countries at the monthly level, with data usually released a few months later1,12. Observations of CO2 concentration in the atmosphere are available in near-real time13,14, but the influence of the natural variability of the carbon cycle and meteorology is large and masks the variability in anthropogenic signal over a short period15,16. Satellite measurements for the column CO2 inventory17 have large uncertainties and also reflect the variability of the natural CO2 fluxes18, and thus cannot yet be used in near-real time to determine anthropogenic emissions.
Read original full article
|
| |
|
|
Back to Featured Articles
|
|
|
|
|
|
|
|
|
|
|
|
Energy News
|
|
| |
| |