|
|
|
|
| Thu, 18th Mar 2021 0:00:00 |
|
Analysis: UK is now halfway to meeting its ‘net-zero emissions’ target |
The UK’s greenhouse gas emissions in 2020 were 51% below 1990 levels, according to new Carbon Brief analysis. This means the UK is now halfway to meeting its target of “net-zero” emissions by 2050.
The milestone was reached after a record-breaking 11% fall in greenhouse gas emissions in 2020, largely due to the coronavirus pandemic. Emissions are likely to rebound this year or next as the economy recovers.
The nature of the decline in 2020 shows how challenging it will be for the UK to eliminate its remaining emissions. It also illustrates the progress made so far, ahead of the UK hosting the COP26 UN climate summit in November.
Here, Carbon Brief sets out what contributed to the fall in emissions in 2020 and what it means for the next phase of the UK’s legally binding net-zero goal.
In 1990, the year Margaret Thatcher resigned after more than a decade as prime minister, the UK’s greenhouse gas emissions stood at 794m tonnes of carbon dioxide equivalent (MtCO2e).
This is conventionally taken as the baseline for the UK’s climate goals, including the net-zero target under its legally binding Climate Change Act and its international pledge to the Paris Agreement.
(Net-zero is formulated in law as cutting greenhouse gas emissions to “at least 100%” below 1990 levels by 2050. As it stands, the target currently does not directly include emissions from international aviation and shipping, though the government’s climate advisers want this to change.)
It has taken 30 years for UK emissions to fall 51% below 1990 levels, according to Carbon Brief’s new analysis of government data. This is halfway to net-zero, with another 30 years to reach the target. (Progress would have been slightly slower if including international aviation and expected changes to the UK’s greenhouse gas inventory. The target will not include emissions associated with UK consumption of goods and services imported from overseas.)
A look back to 1990 helps to explain why emissions have fallen so far in those intervening years – and what remains to be tackled on the road to net-zero.
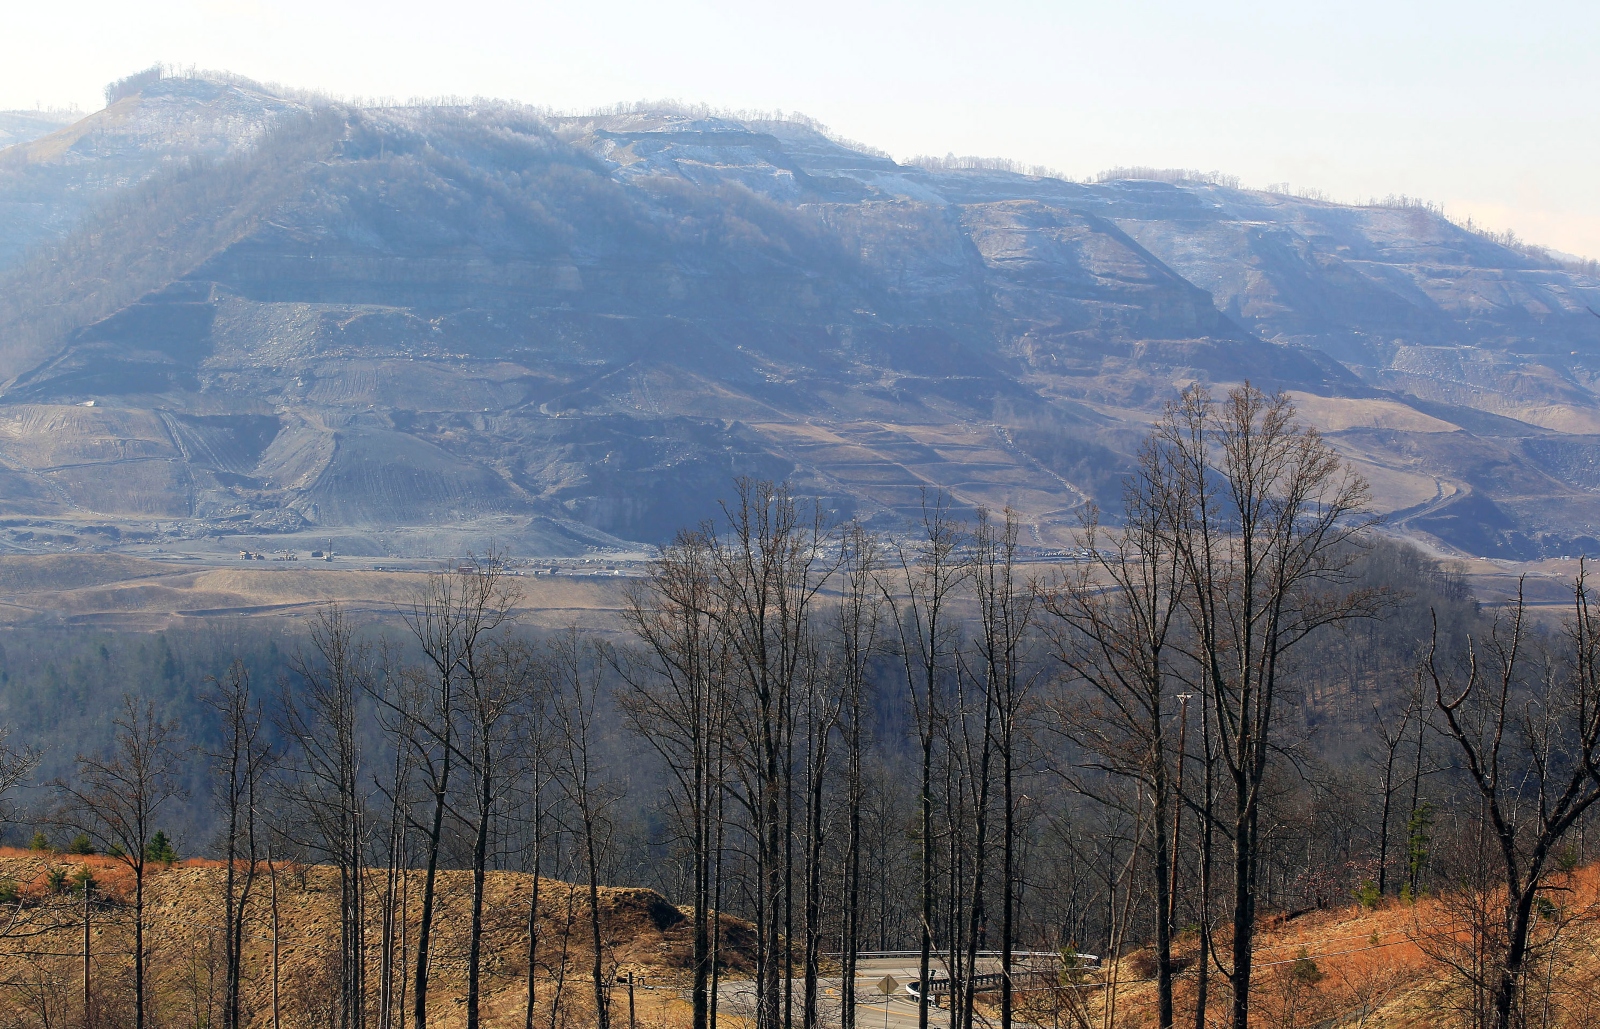
Despite Thatcher’s clash with mining unions in the 1980s, coal still made up two-thirds of electricity in 1990, making the power sector the largest contributor to the nation’s emissions at that time.
The “dash for gas” had yet to reshape the electricity market – and oil power still made up 10% of generation. Renewables made up just 2% of the mix, almost exclusively from hydro.
Industrial processes released powerful greenhouse gases, such as halocarbons and nitrous oxide, with limited controls. Methane leaked from gas fields, landfill sites and coal mines.
By 2019, the UK’s greenhouse gas emissions had been dramatically reduced, falling to 45% below 1990 levels even as the economy grew by nearly 80%.
Almost all of the fall in emissions between 1990 and 2019 had been due to major changes in just three areas, which together account for roughly 90% of the decline:
- Electricity supplies that no longer rely on coal (in round numbers, about 40%);
- Cleaner industry (40%), including manufacturing and waste industry emissions controls on landfill methane, halocarbons and nitrous oxide (25%), as well as more efficient industrial processes and a structural shift away from carbon-intensive manufacturing (15%);
- A smaller and cleaner fossil fuel supply industry, with lower methane emissions from coal mines and leaky gas distribution pipes (10%).
Much slower progress had been made on the gas used to heat homes and offices, which by 2019 made up a fifth of the UK’s emissions, despite more efficient boilers and better insulation.
Meanwhile, almost no progress had been made in transport, which was by 2019 responsible for more than a quarter of the UK’s emissions and was the single largest contributor.
In 2020, the pattern of emissions reductions was very different to that seen in previous years, largely as a result of the unique impacts of the coronavirus pandemic.
Based on analysis of government energy use data, Carbon Brief estimates that UK greenhouse gas emissions fell by 11% in 2020. (See methodology note, below, for more details.)
This would be the largest percentage reduction since at least 1990, as the chart below shows, eclipsing the fall in the wake of the global financial crisis.
Looking at CO2 only, the estimated 13% drop in 2020 would be the fastest annual decline on record in figures stretching back to 1850, excluding years with widespread industrial action.
The drop in 2020 marks a record eighth consecutive year of reductions in the UK.
(Notably, one of the largest recent annual increases came in 2010, as the economy rebounded after the financial crisis. The big jump in 2012 was due to a surge in coal power output, partly caused by cheap imports from the US in the wake of its shale-gas revolution.)
Looking at the causes of the record fall in UK emissions in 2020, the largest contribution was from lower oil use, making up around 60% of the overall reduction.
Oil demand crashed by 18% year-on-year in 2020, largely as a result of the coronavirus pandemic.
Reduced petrol and diesel sales account for around 88% of the fall in UK oil demand last year overall, with a further 4% from the drop in domestic aviation. This contrasts with the situation up until 2019, where transport emissions had barely changed for 30 years.
The reduction in oil demand is clearly reflected in lower fuel duty receipts for 2020, which were down by a fifth compared to 2019 and by nearly three-fifths during the height of the first lockdown.
In total, this means that Covid-related lockdowns cost the Treasury around £5bn in lost revenues from petrol and diesel sales alone.
Within the total for road transport fuels, different segments have been affected more or less strongly, as shown in the chart below. Cars saw the largest reductions in miles driven during the first three quarters of 2020, whereas deliveries by vans and trucks were less strongly hit.
Notably, the figures show government fuel-duty receipts remaining more than a fifth below normal levels during January 2021, as the UK’s Covid lockdowns continued.
Nevertheless, the fall in oil use can still be expected to reverse as restrictions unwind, because there have not been structural shifts to push transport away from its heavy reliance on fossil fuels.
The expected move towards greater home working and consequent reduced commuting by car may be counterbalanced by a reluctance to use public transport, for example, potentially meaning heavier use of private vehicles. Efforts to encourage cycling and walking will likely take time to bear fruit.
Meanwhile, although plug-in electric vehicles are seeing rapid growth and now account for more than 10% of new UK car sales, they still make up less than 1% of the 32m cars on the roads. This means they are, for now, having a negligible impact on transport emissions.
The second-largest factor in 2020 was lower gas use, down 8% due to a combination of warmer weather and reduced gas power output. More than half of UK CO2 emissions are now from gas.
Most of the fall in gas use – around three-fifths of the total – was due to lower gas-fired electricity generation. This is explored in more detail in the next section and was only partly Covid-related.
The other two-fifths of the fall in gas use was mainly down to reduced heating demand, as a result of warmer weather and Covid restrictions, which saw shops and hospitality closed for long periods.
In 2020, the number of “heating-degree days” – a measure of building heat demand – was 14% below the long-term average for 1981-2010, as the chart below shows. But the 2020 figure – including a particularly mild January – was also 6% lower than in 2019.
The long-term shift towards fewer heating degree days in the UK is due to the escalating impact of global warming. A year as warm as 2020 would historically have been expected only once every 90 years, whereas climate change has increased the likelihood to once every other year.
Nevertheless, the gas used to heat the majority of buildings in the UK will remain a major issue on the road to net-zero, as it still accounts for a fifth of overall emissions.
The electricity sector is where the large majority of UK emissions cuts have occurred over the past decade, during which the country’s power supplies have been transformed.
In 2020, emissions in the power sector fell again, as its structural shift away from coal and gas continued. Lower coal power output pushed demand for the fuel down again, from already very low levels, meaning this made a relatively small contribution to the overall change in UK emissions.
Coal met just 1.6% of generation and the UK went without coal power on 180 of the 366 days last year (49%). This compares with just 83 days in 2019 and 21 days in 2018.
Last year also saw a marked 15% drop in gas generation thanks to lower demand and another increase from renewables. The longer-term trend towards lower electricity demand continued and was accelerated by the impact of Covid lockdowns, with a 4% reduction in 2020.
Since 2010, UK electricity demand has fallen by 58 terawatt hours (TWh, 15%), an amount equivalent to more than two Hinkley Point C new nuclear plants (26TWh).
At the same time, the UK has significantly expanded its capacity of windfarms, solar parks and bioenergy plants, meaning the 43% share of electricity generated by renewables was larger than from fossil fuels for the first time in 2020.
Wind power alone contributed 25% of electricity generation in 2020 after an 18% annual increase, thanks to the completion of two new offshore windfarms, Hornsea One and East Anglia One. These added an extra 2 gigawatts (GW) and brought the total for offshore wind capacity to more than 10GW. The year was also windier than 2019, with average wind speeds up 10%.
Bioenergy generated 13% of electricity, rising by 6% year-on-year. Note that the burning of wood pellets at Drax makes up only around a third of overall biomass electricity supplies.
A further third comes from smaller plants that burn plant biomass, most of which is also wood. These smaller plants – such as the Iggesund cardboard factory in Workington, Cumbria – typically rely on domestic sources and predominantly take low-value forestry streams or waste wood. The final third of biomass electricity comes from landfill gas, anaerobic digestion and sewage sludge.
Meanwhile, nuclear generation fell by 11% due to prolonged outages at Dungeness, Hunterston and Hinkley Point B, but the sector still made up 16% of the UK total. All but one of the UK’s remaining nuclear plants are due to retire by 2030.
EMISSIONS LIKELY TO REBOUND IN 2021 OR 2022
The UK’s progress in cutting emissions has been built on structural shifts away from coal power and towards renewables, as well as a cleaner, less carbon-intensive industrial base.
Yet the reductions in 2020 were largely one-off and unique to the coronavirus pandemic, with lockdowns persisting through much of the year in the UK. As a result, the country’s economic output declined by an estimated 10%, posting the biggest hit in the G20 group of nations.
The government’s Office for Budget Responsibility (OBR) has forecast a bounceback in economic growth of 4% this year and 7% in 2022, naturally raising questions about the impact on emissions.
Since so much of the reduction in UK emissions last year was due to cars parked on driveways, an emissions rebound is also likely, though its timing and strength will depend on the pace of the recovery, the length of ongoing Covid restrictions and the impact of ongoing structural changes.
The chart below shows how UK greenhouse gas emissions have changed each year since 1990 and the contributions to these changes from economic growth and from changes in the emissions associated with each unit of GDP.
The chart also shows what would happen to emissions growth in 2021 and 2022, assuming GDP follows the OBR forecast and if the UK’s emissions intensity improves at the same rate as it has, on average, each year since 2000.
If these assumptions hold, then emissions might not increase this year – but 7% GDP growth in 2022 would all but guarantee an emissions rebound. It is worth emphasising, however, that there are at least two reasons to doubt these assumptions will hold true.
First, the OBR’s GDP forecast has changed significantly since November and is likely to change again. Second, the chart shows that the UK’s emissions intensity failed to follow the historical trend during the recovery from the global financial crisis. Given the uniqueness of last year’s conditions, there is every reason to believe the trend could be broken again in the post-Covid recovery.
The likelihood of an emissions rebound as the economy recovers makes it all the more clear that the UK will need to focus on structural changes – rather than one-off events – if it is to meet its net-zero emissions target over the next 30 years.
UK CO2 EMISSIONS NOW LOWEST SINCE 1879
As Carbon Brief has documented the decline in UK emissions over the past five years it has become traditional to compare the current total to the historical record.
In 2018, Carbon Brief analysis showed that UK CO2 emissions had fallen to levels last seen in 1890, during the late Victorian era, a point repeated in press reports and by ministers in parliament.
The record decline last year means the UK’s CO2 output in 2020 was the lowest since 1879, outside years affected by general strikes, as the chart below shows.
That year, Benjamin Disraeli was British prime minister, the country was at war with the Zulus and Thomas Edison had just applied to patent his lightbulb.
Intriguingly, the chart shows that the UK’s CO2 emissions in 2020 were lower than the amount released from coal burning alone in 1970. It also highlights how gas is the largest contributor to the total, with oil a close second and coal far behind after its near-elimination from the power sector.
PER CAPITA UK EMISSIONS NOW CLOSE TO WORLD AVERAGE
On a per-capita basis, given the UK population has more than doubled over the past century, CO2 emissions are now as low as they were in 1853.
At 4.5tCO2 per person, the average UK resident’s emissions are now roughly in line with the global average.
The UK’s per-capita emissions are now not only substantially lower than in the US, at 13.8tCO2 per person, but also the 7.5tCO2 for China. However, the UK’s per-capita figure remains around three times those for the average Indian.
At the global level, while the timing of net-zero is expected to vary between countries, overall human-caused greenhouse gas emissions must reach net-zero in order to stabilise the world’s temperature.
HOW CARBON BRIEF ESTIMATED UK EMISSIONS IN 2020
Carbon Brief’s estimates of the UK’s greenhouse gas emissions in 2020 are based on analysis of provisional energy use figures published by BEIS on 25 February 2021. The same approach has accurately estimated year-to-year changes in emissions in previous years (see table).
One large source of uncertainty is the provisional energy use data, which BEIS revises at the end of March each year and often again later on. Emissions data is also subject to revision in light of improvements in data collection and the methodology used.
The table above applies Carbon Brief’s emissions calculations to the latest energy use and emissions figures, which may differ from those published previously.
Another source of uncertainty is the fact that Carbon Brief’s approach to estimating the annual change in emissions differs from the methodology used for the BEIS provisional estimates. This is largely because BEIS has access to more granular data, which is not available for public use.
In Carbon Brief’s approach, UK CO2 emissions are estimated by multiplying the reported consumption of each fossil fuel, in energy terms, by its emissions factor. This is the amount of CO2 released for each unit of energy consumed and it varies for different fuels.
For example, diesel, petrol and jet fuel have different emissions factors and Carbon Brief’s analysis accounts for this where possible. This adjustment is based on the quantity of each fuel type used per year, drawn from separate BEIS figures covering oil, coal and gas.
Emissions from land use and forestry are assumed to remain at the same level as in the previous year. Carbon Brief also uses the same approach as the BEIS methodology for estimating the change in emissions from greenhouse gases other than CO2.
Note that the figures in this article are for emissions within the UK measured according to international guidelines. This means they exclude emissions associated with imported goods, including imported biomass, as well as the UK’s share of international aviation and shipping.
The Office for National Statistics (ONS) has published detailed comparisons between various different approaches to calculating UK emissions, on a territorial, consumption, environmental accounts or international accounting basis.
The UK’s consumption-based CO2 emissions increased between 1990 and 2007. Since then, however, they have fallen by a similar number of tonnes as emissions within the UK.
Bioenergy is a significant source of renewable energy in the UK and its climate benefits are disputed. Contrary to public perception, however, only around one quarter of bioenergy is imported.
International aviation is considered part of the UK’s carbon budgets and faces the prospect of tighter limits on its CO2 emissions. The international shipping sector has a target to at least halve its emissions by 2050, relative to 2008 levels.
Read original full article
|
| |
|
|
Back to Featured Articles
|
|
|
|
|
|
|
|
|
|