|
|
|
|
|
|
|
|
|
|
|
|
|
|
|
| Wed, 6th May 2020 13:16:00 |
|
Climate change and coronavirus: Five charts about the biggest carbon crash |
We're living through the biggest carbon crash ever recorded.
No war, no recession, no previous pandemic has had such a dramatic impact on emissions of CO2 over the past century as Covid-19 has in a few short months.
Multiple sources indicate we are now living through an unrivalled drop in carbon output.
But even though we will see a massive fall this year, the concentrations of CO2 that are in the atmosphere and warming our planet won't stabilise until the world reaches net-zero.
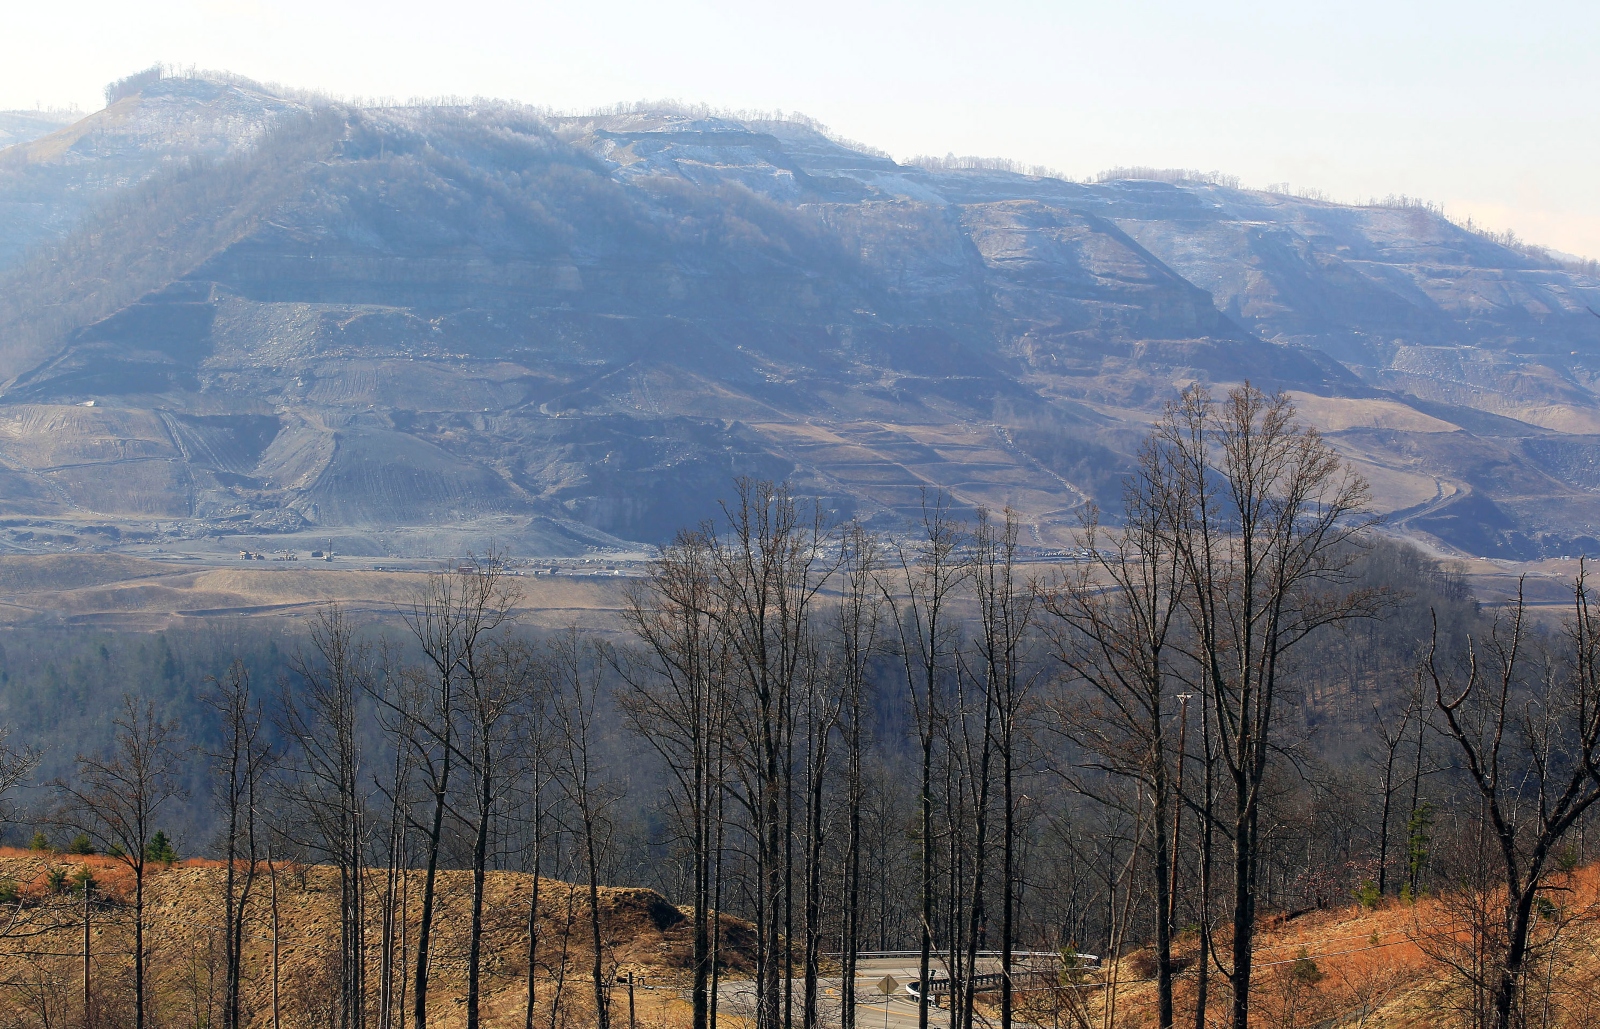
As our chart shows, since the Spanish flu killed millions over 100 years ago, the global expansion of emissions of CO2, from the use of oil, gas and coal has risen massively.
While these energy sources have transformed the world, the carbon seeping into our atmosphere has driven up global temperatures by just over 1C since the mid-1850s.
They could rise by 3-4C by the end of this century if CO2 levels aren't savagely reduced.
Over the past 100 years, as indicated on the graphic, a number of events have shown that dramatic falls in carbon are possible.
Much is made of the financial crash in 2008-2009, but in reality, carbon emissions only fell by around 450 million tonnes between 2008 and 2009.
This is much smaller than the fall in CO2 in the aftermath of World War II, which saw a drop of around 800 million tonnes.
Read original full article
|
| |
|
|
Back to Featured Articles
|
|
|
|
|
|
|
|
|
|
|
|
Energy News
|
|
| |
| |